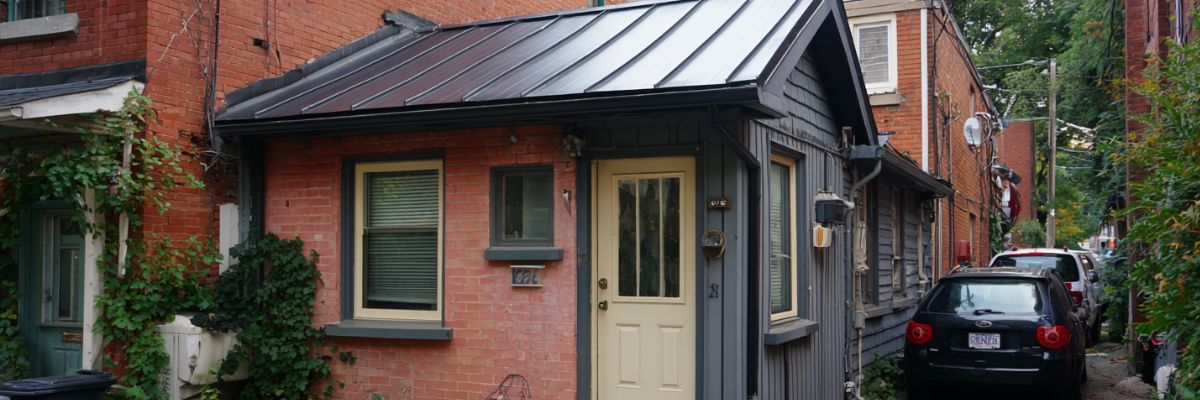
What is The ROI of Building a Laneway Home in Toronto? (2025)
ROI of Building a Laneway Home in Toronto (2025)
The ROI for a laneway home in Toronto typically ranges from about 7.0% to 8.3% in 2025 when measured as gross annual rent divided by total construction cost.
Using conservative rent and cost assumptions, a Budget build around $175,000 that earns about $14,400 per year returns roughly 8.23%.
A Mid Range build near $275,000 with about $20,400 in annual rent delivers roughly 7.42%.
A Luxury build around $425,000 that rents for about $30,000 per year comes in near 7.06%.
These figures assume monthly rents of approximately $1,200 for Budget, $1,700 for Mid Range, and $2,500 for Luxury for laneway suites of roughly 300 to 1,000 sq ft. The data shows a clear pattern - lower upfront cost paired with solid rent produces the highest percentage ROI, while higher spec projects command more rent but see ROI soften because costs rise faster than income. The rest of this guide explains how to apply these numbers to laneway specific realities in Toronto.
How This ROI Was Calculated
The baseline formula and why it is useful
The baseline ROI here is gross annual rent divided by total build cost, expressed as a percentage. It is simple, transparent, and allows apples to apples comparison across build tiers. While it does not subtract expenses, it offers a clean first pass view of return potential.
Core inputs for laneway homes
Budget - about $175,000 build cost and about $14,400 annual rent
Mid Range - about $275,000 build cost and about $20,400 annual rent
Luxury - about $425,000 build cost and about $30,000 annual rent
Unit sizes - roughly 300 to 1,000 sq ft with conservative rent assumptions that are achievable in well located Toronto neighborhoods
Tier by Tier ROI for Laneway Homes
Budget laneway home - strongest percentage ROI
Typical ROI - about 8.23%
Profile - compact footprint, efficient layouts, durable mid grade finishes, simplified exterior details
Why it works - every dollar of rent comes from a lower cost base. Light, storage, privacy fencing, and resilient finishes do the heavy lifting. The result is the highest percentage ROI and the shortest gross payback among the three tiers.
Mid Range laneway home - balanced ROI with broad appeal
Typical ROI - about 7.42%
Profile - better kitchen and bath packages, in suite laundry, improved envelope, more refined exterior, small design upgrades that photograph well
Why it works - rent rises with finish quality and livability. ROI softens a little because each extra dollar of rent costs more to unlock, yet tenant appeal and lower turnover often improve the ownership experience.
Luxury laneway home - premium positioning with slightly lower percentage ROI
Typical ROI - about 7.06%
Profile - larger footprints, premium cabinets and surfaces, feature lighting, skylights or clerestories, custom millwork, complex rooflines
Why it works - rent is high, but costs climb faster than rent. Absolute monthly income can still be attractive for owners who value premium positioning, longer tenancies, and strong marketing visuals.
Payback Periods and What They Mean
Years to recoup build costs from gross rent
Budget - roughly 12.2 years
Mid Range - roughly 13.5 years
Luxury - roughly 14.2 years
Because the denominator is smaller, Budget recoups faster. Mid Range and Luxury push breakeven out as cost scales faster than rent.
How to interpret payback
Payback is easy to grasp, but it is not a full pro forma. It ignores appreciation, taxes, and financing. Many owners planning a 10 year hold choose the path that balances net income, tenant quality, and lower maintenance rather than chasing the very shortest payback alone.
From Gross ROI to Net Yield
Adjusting for vacancy and operating costs
A quick reality check is to apply a 5% vacancy factor and a 20% operating expense ratio to collected rent. That yields a simple estimate of net operating income and net yield.
Budget - gross 8.23% becomes about 6.25% net
Mid Range - gross 7.42% becomes about 5.64% net
Luxury - gross 7.06% becomes about 5.36% net
Monthly net income before debt service
Budget - about $10,944 per year or about $912 per month
Mid Range - about $15,504 per year or about $1,292 per month
Luxury - about $22,800 per year or about $1,900 per month
To stay cash flow positive, total monthly debt and ownership carrying costs need to sit below these figures.
Sensitivity Analysis - What if rents or costs change
If rents move by 10%
Because rent sits in the numerator, a 10% rent change shifts ROI by about 10%. For example, Budget rises from about 8.23% to about 9.05% if rent increases by 10%, and drops to about 7.41% if rent falls by 10%. Payback shortens or lengthens accordingly. Mid Range and Luxury follow the same pattern.
If build costs move by 10%
A 10% cost increase reduces ROI by about 9% to 10% and extends payback. A 10% cost decrease does the opposite. This is why tight scope control, value engineered design, and schedule discipline are the biggest levers you have to protect returns.
What Drives Rent and ROI for Laneway Homes
Location and tenant pool
Laneway homes close to transit, employment nodes, and amenities lease fastest and at the top of market rates. Quiet residential lanes with adequate lighting, good snow clearing, and easy access to the street help tenant comfort. If your neighborhood already supports strong rents for small free standing dwellings, a well designed laneway home will usually hit the conservative rents used in this analysis.
Size and layout efficiency
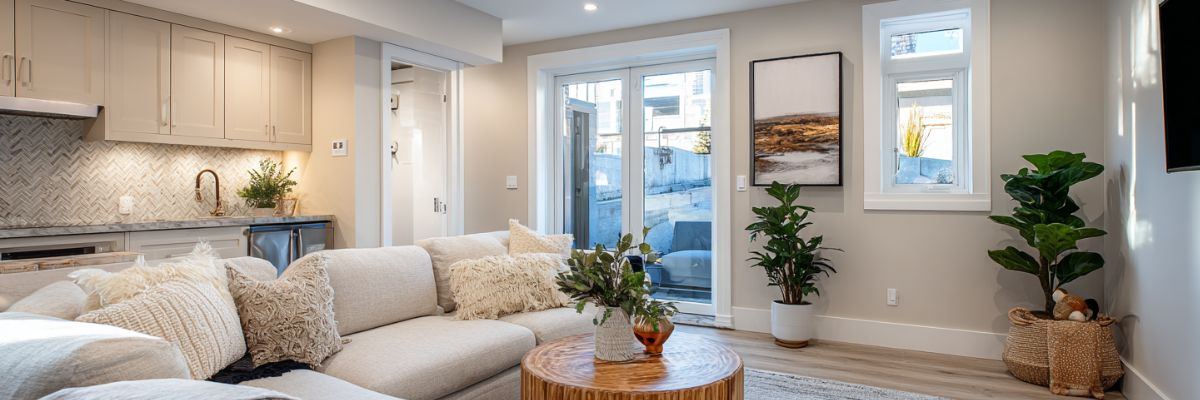
Right sizing matters. A compact one bedroom or well planned two bedroom that avoids wasted corridors is the sweet spot for many lots. Open kitchen living areas, generous glazing, and smart storage make smaller footprints live larger. Every square foot that is both leasable and livable lifts rent per square foot and reduces vacancy risk.
Finish level and durability
Choose materials that photograph well and endure. Solid surface counters, resilient flooring, tile in wet zones, and reliable appliance packages keep maintenance low and tenant satisfaction high. Luxury upgrades can look great, but at the margin they rarely produce rent gains that fully justify their extra cost.
Energy performance and utilities
Good insulation, right sized HVAC, and efficient windows improve comfort and operating costs. If separate metering is practical, it can protect net income. Even when utilities are partly owner paid, efficiency helps NOI by lowering bills.
Laneway Specific Considerations in Toronto
Site access and fire routing
Laneway homes must provide safe and clear access from the street to the unit for residents and emergency services. Early coordination on path widths, gates, and lighting prevents design rework and inspection delays.
Servicing and utility runs
Water, sanitary, storm, gas, power, and data typically require trenching from the main house or from the lane if available. Electrical service upgrades at the main panel are common. These runs are a meaningful cost line and should be priced early to avoid budget surprises.
Privacy, glazing, and shadowing
Design choices that preserve neighbor privacy and manage overlook often smooth approvals and reduce friction. Consider window placement, sill heights, and tasteful screening to balance light with privacy.
Parking, grading, and snow storage
Lane conditions vary. Confirm parking requirements, turning radii, grading, and where snow can be stored. Practical site planning avoids future tenant complaints and winter access issues.
Trees, heritage, and conservation
Mature trees and heritage contexts can introduce constraints and fees. Early arborist input and heritage review, when applicable, keep the schedule realistic and reduce change orders.
Cost Control Strategies That Protect ROI
Lock scope early and avoid drift
Freeze the program at schematic design. A new dormer, a custom stair, or an added skylight compounds cost faster than it grows rent. Keep a must have list and push nice to haves to a later phase if needed.
Standardize specifications
Use repeatable assemblies and supplier packages. Standard window sizes, stock cabinet lines, and consistent fixture sets reduce waste and shorten lead times. Builders price certainty better than one off products.
Design for simplicity
Straight rooflines, stacked plumbing, simple wall layouts, and efficient spans keep trades productive. Complex geometry and mid build changes introduce delays and change orders that erode ROI.
Consider modern delivery methods
Prefab, panelized framing, or modular elements can shorten schedules and improve quality control on tight sites. Not every lot or design fits, but it is worth testing during preconstruction pricing.
Risk and Compliance
Permits, inspections, and documentation
Complete drawings, permitted work, and clean inspection history reduce buyer and lender risk and support future refinancing or resale. Keep a tidy binder with plans, permits, inspection reports, warranties, and manuals. Documentation is part of the value proposition.
Construction risks and contingency
Carry a contingency of about 10% to 15% based on lot constraints and the age of the primary dwelling. Older electrical service, unforeseen soils, or utility conflicts can add cost. Good preconstruction surveys and utility locates help prevent surprises.
Who Should Choose Each Tier
Budget - maximize percentage ROI and faster payback
Best for owners who want a simple, durable suite with predictable cash flow. Compact one bedroom layouts with resilient finishes keep leverage low and numbers strong.
Mid Range - widen tenant appeal without overbuilding
Ideal for long term holds where tenant quality, lower turnover, and professional photos matter. Thoughtful upgrades improve livability and marketing without breaking the budget.
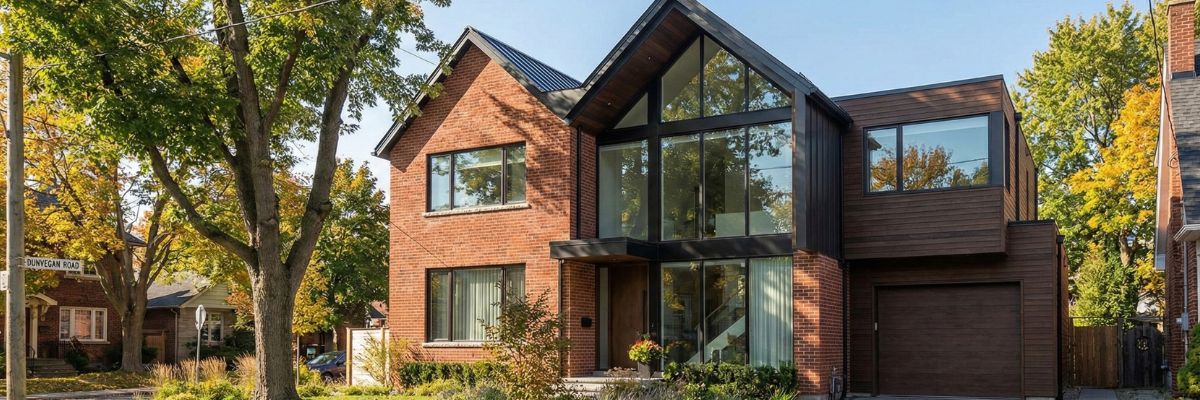
Luxury - premium tenant profile and showcase value
Fits lots and neighborhoods that support top of market rents. The percentage ROI is lowest of the three tiers, but absolute monthly NOI can be attractive if you value premium positioning and long tenancies.
Action Plan to Maximize ROI
Step 1 - verify rents from real local comps
Pull recent laneway or small free standing home rents within a tight radius for similar size and finish. Underwrite with conservative numbers.
Step 2 - align design to your rent target
Size the unit and specify finishes that achieve your rent within budget. Focus dollars on kitchens, baths, light, privacy, and storage - the details that tenants value and that show well in photos.
Step 3 - price two spec packages
Request bids for a base spec and a value engineered alternative. Compare the rent impact to the cost delta and choose the package that delivers the best rent per dollar invested.
Step 4 - protect schedule
Lead times and idle labor quietly crush ROI. Order long lead items early, batch inspections when possible, and hold weekly check ins with clear deliverables.
Bottom Line
Laneway homes in Toronto offer a compelling blend of monthly income and long term property value. On gross figures, Budget returns about 8.23%, Mid Range about 7.42%, and Luxury about 7.06% using conservative rents for 300 to 1,000 sq ft units. Budget delivers the strongest percentage ROI and the shortest payback, Mid Range balances finish quality and tenant appeal with solid returns, and Luxury offers premium positioning with slightly lower percentage returns. Your best outcome will come from aligning design and finish level to your neighborhood, controlling scope and cost, and underwriting with realistic rents and operating assumptions. Done right, a laneway home converts underused rear lot space into a durable income stream and a marketable asset that strengthens the overall value of your property.

.jpg)
.jpg)

.jpg)
